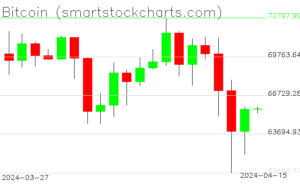
Bitcoin charts on April 16, 2024

Bitcoin Support and Resistance Please Read Our Explanation and … Continue reading →

Bitcoin Support and Resistance Please Read Our Explanation and … Continue reading →
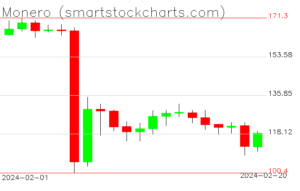
Monero Support and Resistance Please Read Our Explanation and … Continue reading →
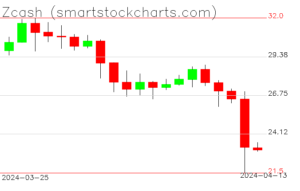
Zcash Support and Resistance Please Read Our Explanation and … Continue reading →
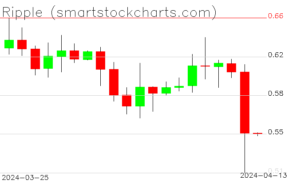
Ripple Support and Resistance Please Read Our Explanation and … Continue reading →
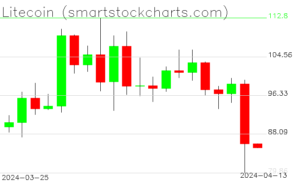
Litecoin Support and Resistance Please Read Our Explanation and … Continue reading →
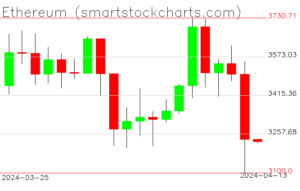
Ethereum Support and Resistance Please Read Our Explanation and … Continue reading →
Bitcoin Support and Resistance Please Read Our Explanation and … Continue reading →
Monero Support and Resistance Please Read Our Explanation and … Continue reading →
Zcash Support and Resistance Please Read Our Explanation and … Continue reading →
Ripple Support and Resistance Please Read Our Explanation and … Continue reading →
Litecoin Support and Resistance Please Read Our Explanation and … Continue reading →
Ethereum Support and Resistance Please Read Our Explanation and … Continue reading →
Bitcoin Support and Resistance Please Read Our Explanation and … Continue reading →
Zcash Support and Resistance Please Read Our Explanation and … Continue reading →
Ripple Support and Resistance Please Read Our Explanation and … Continue reading →