10 Ways on How to Deal with Trading Losses

10 Ways on How to Deal with Trading Losses Virtually … Continue reading →

10 Ways on How to Deal with Trading Losses Virtually … Continue reading →
IBB Support and Resistance 5-Day Outlook: Decreasing Volatility … Continue reading →
VTI Support and Resistance 5-Day Outlook: Bullish Maximum … Continue reading →
SLV Support and Resistance 5-Day Outlook: Decreasing Volatility … Continue reading →
EWG Support and Resistance 5-Day Outlook: Bullish Maximum … Continue reading →
SPY Support and Resistance 5-Day Outlook: Bullish Maximum … Continue reading →
VNQ Support and Resistance 5-Day Outlook: Bullish Maximum … Continue reading →
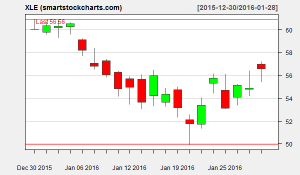
XLE Support and Resistance 5-Day Outlook: Bullish Maximum … Continue reading →
TLT Support and Resistance 5-Day Outlook: Bullish Maximum … Continue reading →
GLD Support and Resistance 5-Day Outlook: Bullish Maximum … Continue reading →
QQQ Support and Resistance 5-Day Outlook: Bullish Maximum … Continue reading →
XLE Support and Resistance 5-Day Outlook: Bullish Maximum … Continue reading →
TLT Support and Resistance 5-Day Outlook: Bullish Maximum … Continue reading →
GLD Support and Resistance 5-Day Outlook: Decreasing Volatility … Continue reading →
QQQ Support and Resistance 5-Day Outlook: Decreasing Volatility … Continue reading →