Sector Rotation Momentum Strategy Using ETFs
Sector Rotation Momentum Strategy Using ETFs
I’ve come across a momentum strategy that uses sector rotation in the UK markets to generate returns of 20% a year from 1965 to 2014 compared to 13% from just buying and holding the UK market. Unfortunately, the blog that published the article is no longer with us today but here’s an archived copy if you’re interested.
Since I don’t have access reliable UK historical sector returns (and index funds that invest in the sectors didn’t exist back in 1965), I’ve decided to do a similar study on my home market: the US. I’ve chosen the following SPDR ETFs which have been trading since 1999 as the investment vehicles a hypothetical investor would have utilized to realize the backtested performance:
- XLF: Financials
- XLE: Energy
- XLU: Utilities
- XLK: Technology
- XLB: Materials
- XLI: Industrials
- XLV: Health Care
- XLP: Consumer Staples
- XLY: Consumer Discretionary
And as the market benchmark, I’ll be using the SPDR S&P 500 fund, SPY.
The trading rules are the same as those for the UK portfolio:
At the end of the first trading day of each quarter, find last quarter’s top 2 performing sectors out of the 9 listed above and invest 50% of your portfolio into each of these 2 sectors. Rebalance your portfolio back to 50/50 on the first trading day of each month as well.
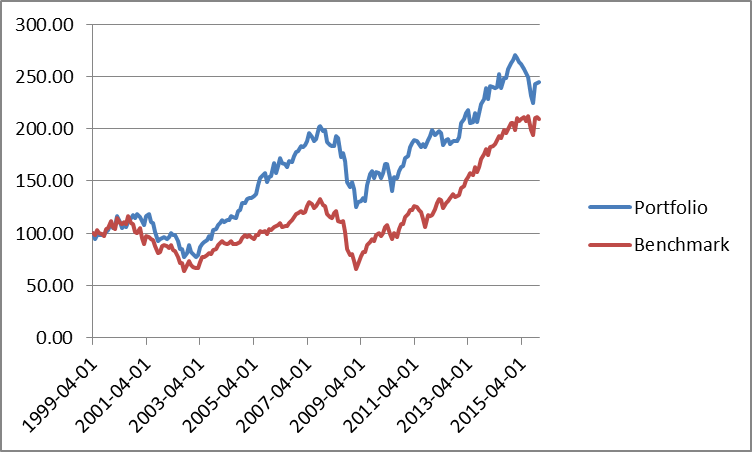
Momentum Strategy results from April 1999 to December 2015:
| Portfolio | SPY | |
| Return | 5.39% | 4.52% |
| Volatility | 14.23% | 15.04% |
| Max Monthly Drawdown | -38.34% | -50.78% |
| Sharpe (r=5%) | 0.0276 | -0.0318 |
Over these 16 years, the sector rotation momentum strategy improved both return and volatility slightly. But the most dramatic improvement comes from the reduction of maximum monthly drawdown from nearly 51% to 38% during the 2008-2009 crash. Keep in mind that although recoveries from nasty drawdowns like this are obvious in hindsight, it takes great courage to hold through when one’s hard earned money has already been decimated by over 50%. A 38% maximum drawdown, while still quite severe, may not prove to be as gut wrenching for as many investors as to want to give up and sell at those depressingly low prices.
What about commissions and trading costs?
For a large fund managing billions of dollars, trading in and out of the SPDR ETFs on a single day may be impractical and these rotation trades would be performed over the course of a few days (which would not replicate these backtested results based on EoD figures on the 1st of every month.) For most individual investors, the liquidity should not be of any issue but tax inefficiency could wipe out any potential advantage offered by the momentum strategy. So let’s assume you’re implementing this strategy in a tax exempt or tax deferred vehicle (like an IRA.)
5.39% – 4.52% = 0.89% performance improvement. We make a maximum of 2 trades a month on the months that do not correspond to the beginning of a new quarter (8 months) and 4 trades on the months that mark the beginning of a new quarter (4 months.) 2*8 + 4*4 = 32 trades a year. Suppose the average commission per trade at a discount broker is $7; 32*7 = $224/yr in commissions. $224/0.89% = $25,200 which is the minimum portfolio size you’d need to offset the commissions from the momentum strategy.
Final Thoughts
I think this strategy’s overall philosophy shows promise although it still leaves some room for improvement. For example, performing sector rotations every month instead of every 3 months may be an even safer bet in case you happened to buy a sector at the very top. If you have any further ideas for refinement, please feel free to share in the comments!