Expected Returns Mean NOTHING if you don’t know the Skew!
Expected Returns Mean NOTHING if you don’t know the Skew!
Traders talk about the expected returns and even the volatility of an investment but it’s difficult to assess its true risk if you disregard the skew of its returns. What if I tell you about a simple trading strategy that’s almost consistently delivered high success rates throughout history? Are you interested? What if I tell you that by pursuing that strategy, there’s a small but definite probability that you could lose more than several times your net worth? Are you still interested? If so, then you’ll have to wait till the end to find out!
Table of Contents
- Forget the Normal Distribution
- What is Skew and why does it matter?
- So what does the expected return vs. the skew of an investment tell you about it?
- What do penny stocks, the VIX, and lottery tickets have in common?
- Final Thoughts
Forget the Normal Distribution
Academics in Finance and Economics often talk about the Normal Distribution and use it to model the risk and returns of stocks and other investments. While it’s better than nothing, it doesn’t paint an entirely accurate picture of what really happens in the markets. Capitalism is powered by the survival of the fittest and the average company usually has a limited lifespan before it’s ousted by its competition, either through bankruptcy or being acquired by a more successful competitor. And that competitor will stick around for a while before it’s ousted by an even more formidable competitor. However, at the same time, the world economy continues to grow along an upward trajectory (save a few blips like 2008) and the lives of most people, including the owners of those failed companies, continue to improve. With a few outliers accounting for such a disproportionate amount of an entire stock market’s returns, does it make any sense to fixate your analysis by using the normal distribution?
[Back to Table of Contents]
What is Skew and why does it matter?
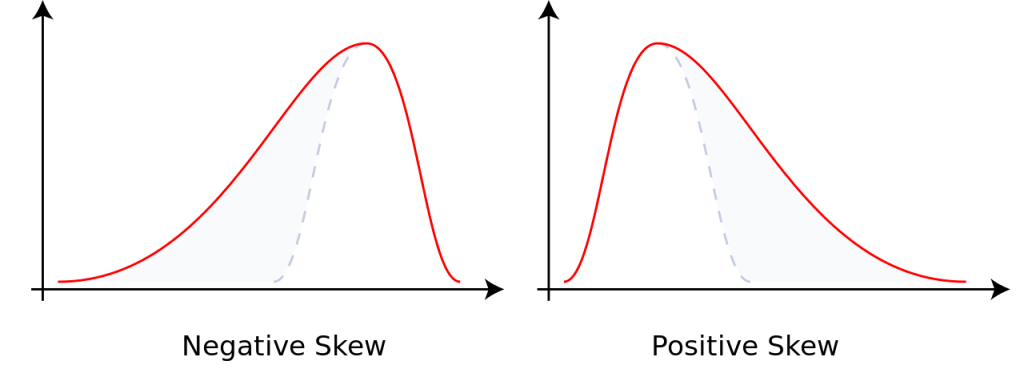
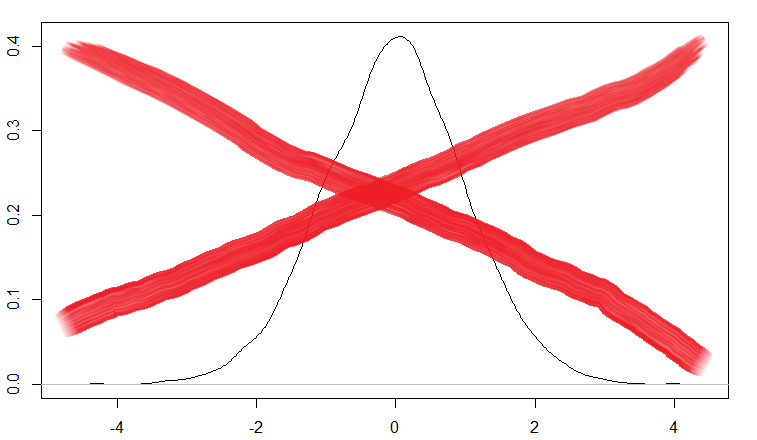
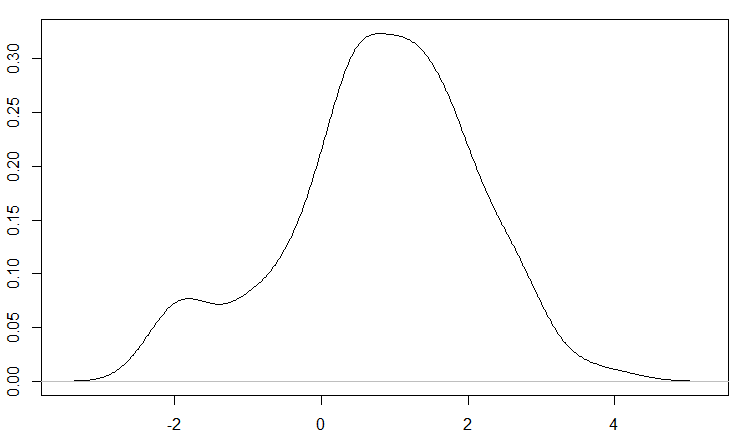
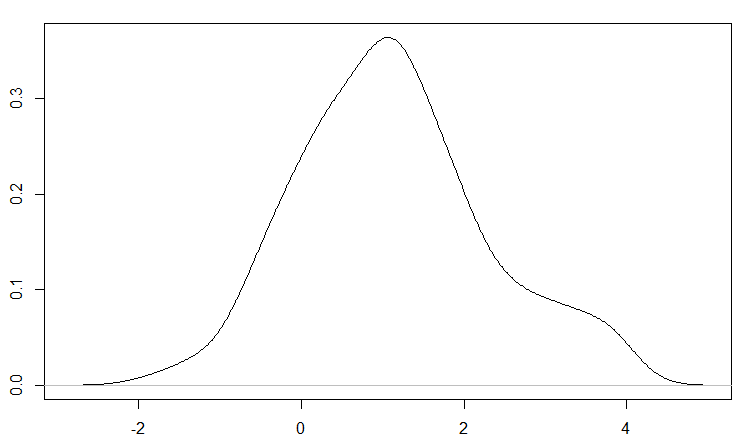
Skewness is defined as the asymmetry of a random variable’s distributions around its mean. (You can find a more mathematical definition that’s beyond the scope of this article on Wikipedia, which also happens to be where the above chart originated.) If a distribution has fat tails or outliers on the positive end and exhibit much higher probability of achieving these positive values than dictated by a normal distribution, then it’s said to have positive skew. On the other hand, a distribution with fat tails or outliers on the negative end is said to have negative skew. Keep in mind that skew can influence the overall mean but the sign of the skew doesn’t necessarily dictate the sign of the mean (i.e. you can have a distribution with negative skew and a positive mean.)
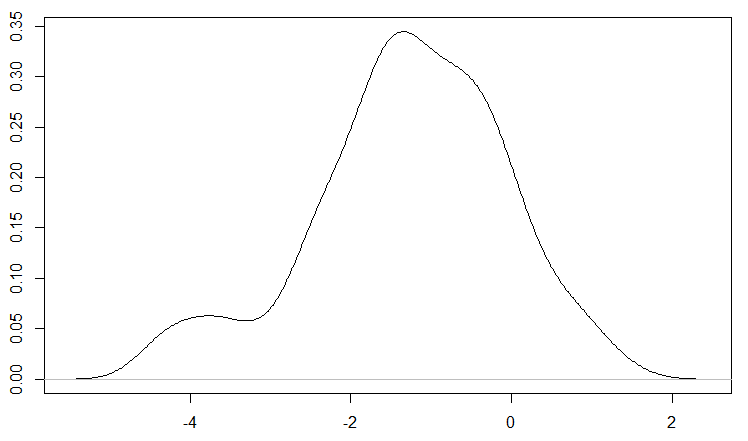
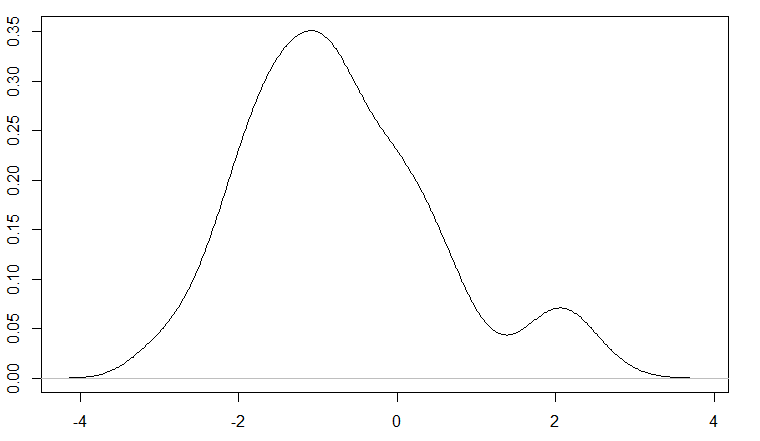 Take a look at the curve above and compare it to the normal distribution from the previous section. You’ll see that the average value of this distribution is a little below 0, compared to the normal distribution with a mean of 0 above. Normal distributions can have non-zero means all right but pay attention and compare the upper tails of both distributions. Even though the second distribution has a negative mean, you’re more likely to achieve values greater than 2 with that than the normal distribution. Statisticians will say that this second distribution has a positive skew but a negative mean. In the markets, an asset with a return distribution that resembles the above can be very confusing to traders and end up causing major losses to those who thought they could outsmart the markets, which I’ll further discuss later in this article.
[Back to Table of Contents]
So what does the expected return vs. the skew of an investment tell you about it?
The following diagram will divide all asset classes into 4 different quadrants based on positive or negative skew and expected return:
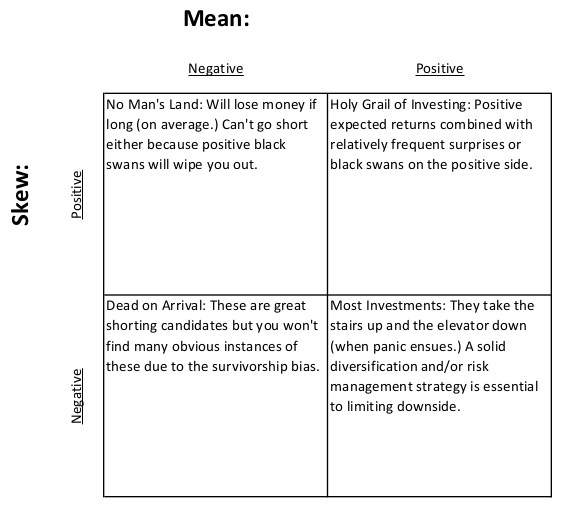
In general, it’s difficult if not outright impossible to determine a single asset’s expected return and skew of possible returns. Nobody knows what’s going to happen to a single stock, a single investment property, a single bond, etc. However, predictions about the future returns and return distributions of an entire market or even asset class (i.e. biotech stocks, Chinese real estate, US government bonds, junk bonds in retail, baseball cards, etc.) are more tractable although still quite difficult to determine. In other words, every individual investment is different but each asset class has defining characteristics that make it a bit more predictable than its individual members. You can use the concepts presented here to guide you in your asset allocation: to determine whether or not a particular asset class’s risks and rewards are suitable to your trading and investing goals.
[Back to Table of Contents]
Quadrant #1: Positive Expected Return, Negative Skew
 Most investments and asset classes follow this sort of distribution for understandable reasons. Investors who buy and hold securities will tend to purchase a small amount of them on regular intervals (say every month), slowly driving up the price and causing the average return to be positive. When panic sets in about distress, a recession, or a financial crisis, investors will sell their securities en masse, causing the fat tail on the negative end. The panic selling often leads to a crash and prices will usually recover much more slowly due to the residual fear even after conditions have improved. In other words, most investments take the stairs on the way up and the elevator on the way down due to people’s fear and greed.
Most conventional means of risk management are designed for dealing with a positive expected return + negative skew market environment. Deciding on a maximum amount you’re willing to risk is a prudent measure if you are expected to make some money on average but have a small but significant chance of losing big (aka a black swan event.)
[Back to Table of Contents]
Quadrant #2: Positive Expected Return, Positive Skew
I call this quadrant the Holy Grail of Investing because not only do you get positive expected returns with these assets but also positive surprises on the upside as well. Investments in this quadrant are highly unstable and ephemeral (much like sodium and other alkali metals in nature), often transitioning into one of the other quadrants once more greedy investors start piling in. (By “unstable”, I don’t mean extremely prone to losing money but instead, not likely to stay in this particular state indefinitely.)
Many assets and even asset classes may have exhibited this type of return distribution in the past but it’s not likely that they’ll persist in the future. Analysts will soon discover securities with such payoffs and write about their bright future prospects, causing traders and investors to pile in on the long side, quickly driving up the prices (in the case of the positive skew.) Prices will then stabilize once less investors deem it to be undervalued and its future prospects will have shifted to a different quadrant by then.
A few asset classes may be able to sustain this sort of payoff distribution simply due to their very low but overall positive returns. For example, short-term US treasures usually return close to the Federal Funds Rate in the long run. However, during times of crisis like in 2008, these short-term treasuries will dramatically rise in price due to a flight to safety.
[Back to Table of Contents]
Quadrant #3: Negative Expected Return, Negative Skew
 Million dollar question: I’ve got an investment for you that is expected to not only deliver negative expected returns but is also prone to negative black swans! Would you like to buy it? You’d probably think I’m crazy for suggesting that! Then how would you like to short it? You’d probably be elated to do so!
I call securities in this quadrant Dead on Arrival. They’d be great candidates for shorting but unfortunately, I couldn’t find any examples from the Wall Street Journal, CNBC, Yahoo Finance, or any other financial news source when I was writing this article and even if I did, it’s probably too late by the time you read this. Why? Securities in this quadrant are also unstable but unlike the opposite quadrant of positive returns + positive skew, securities here are on their way to dying in the near future. You won’t find the stock of a company that’s died off years ago when you search on Google Finance and even if you do, there’s no point in shorting it when it’s already 0. When the prospects of a stock are grim beyond belief, nobody will be willing to buy its stock and the price will fail to 0. It’s the same deal for an entire industry that’s shortly on its way out.
[Back to Table of Contents]
Quadrant #4: Negative expected return, Positive Skew
Before I go into detail, I’ll tell you this upfront: this quadrant can get a lot of speculators in trouble, especially those who think they can outsmart the markets! Notice I didn’t use the word “investor” because no rational investor would ever bother touching this quadrant when there are better opportunities in the other quadrants!
Unfortunately, most investors buying something in this quadrant aren’t even aware of being in it because they were likely sold on something that has a very small probability of making a massive payoff (aka positive skew) without any insight about its negative expected returns. So you might be thinking: with negative expected returns, you can just short it and make a profit. Go short and you’ll have the exact same payoff as the Positive return, Negative skew case, right?
Hold it right there! In most cases, you’ll turn out fine if you short such a security. However, if you get unlucky, you could end up losing more than your entire net worth! At least when you go long, you can only lose what you’ve invested. If you end up shorting a stock that becomes the next Microsoft or Google, you’d be many times in the hole! So I call this quadrant the No Man’s Land for good reason: going either long OR short will easily lead to financial ruin!
A classic example of a security in this quadrant are penny stocks (aka pink sheets, OTC, etc.) Hopefully, you’ve seen the Wolf of Wall Street by now and are fully aware that penny stocks are a dangerous and unsuitable investment for most people. Penny stocks are securities that are not listed on a national exchange and often trade for less than $5 a share, often just several cents per share. Usually these companies are under some sort of financial distress and cannot list their shares on the national exchanges. Most of these stocks eventually go to 0 but a few end up winning huge and go on to be normal stocks listed on an exchange. Also, since they’re not listed on a national exchange, they’re more prone to fraud including price manipulation, inside trading, etc. and their thin trading volume means they’re subject to very high volatility.
“But my backtesting says penny stocks have a positive average return!”
Penny stocks are notorious for survivorship bias since these companies have a much higher probability than the average stock of going bankrupt, so your backtesting results are likely to be heavily inflated. In addition, many financial databases containing data on delisted stocks may only include those listed on exchanges. Even if they do include penny stock data, it may not be that reliable due to their thin trading volumes.
“But I can use stop losses, right?”
Penny stocks, due to their low volumes, ease of manipulation, and high volatility, are more prone to large gaps between trading sessions. When your stock can easily gap up or down beyond your stop loss, it’s a lot more difficult to use stop losses to set a limit to how much you’re willing to lose on the trade. Options might sound like an attractive alternative to stop losses when protecting against losses but keep in mind very few options are traded on penny stocks. And since these options are traded over the counter, there’s no exchange (like the CBOE) that’ll enforce proper settlement should the other side refuse to honor their agreement when you exercise your option.
“But then I’ll just short a tiny amount like 1% of my portfolio in the penny stock!”
Btw, remember the investment strategy that I discussed in the beginning that has a high success rate but will leave you with debt that’s several times your net worth if it fails? Here it is: shorting Penny Stocks!
However, penny stocks can easily double, triple, or quadruple overnight and your stop losses will be worthless protecting you against it. While it may be too far fetched for a penny stock to rise 100 or 1000-fold overnight, shorting a trivial amount of a penny stock just doesn’t make any sense either. If you short 1% of your portfolio’s value in a penny stock and that stock goes to 0, the most you can gain is 1% from that trade. But if it doubles or triples, you’ll lose 2% or 3% respectively. You’re risking a relatively large amount of money to make a tiny amount of profit even in the best case scenario here. It’s just not worth the effort and trouble, in my opinion.
[Back to Table of Contents]
What do penny stocks, the VIX, and lottery tickets have in common?
I’ll tell you this upfront – these all fall into the 4th quadrant: the No-Man’s Land. I’ve went on and on about the perils of penny stocks in the previous section so I’ll brief you on the VIX here. The VIX index is a gauge of “fear” in the markets which is measured as a function of the implied volatility of short-term options on the S&P500. Uncertainty about the markets, the economy, the political situation in the world, etc. all cause the VIX index to rise and certainty causes it to fall. In general, the VIX tends to fall slowly over time, especially if the markets are flat or rising with low volatility. The VIX tends to rise gradually when a bull market accelerates like in the late 90s or spike very dramatically when the markets take a sharp downturn.
Btw, Bill Luby has a fun analogy of relating to the spikes in the VIX with the way his dog reacts to random noises and disturbances throughout the day. After all, VIX is a measure of fear and fear tends to exhibit very distinct patterns in humans and many other animals.
Don’t get me wrong here, the VIX is an extremely valuable indicator to use alongside your stock charts to gauge how much “fear” there is in the markets especially when things are going up or down too quickly. But trouble happens when you start making bets on the VIX itself, which is another example of a 4th quadrant security. While most derivatives of the VIX like its futures, options, and ETFs trade on official exchanges (unlike penny stocks), the VIX exhibits negative returns and positive skew which makes it unsuitable for both the long and short sides (not to mention it also serves little investment purpose other than a speculation tool for BOTH sides of the trade.)
What about Lottery Tickets?
Lottery tickets are probably the 4th quadrant “security” that most people are familiar with (whether or not they’re aware that it belongs here.) I’ve included them merely as point of reference for penny stocks and the VIX since the latter are often “sold” by financial commentators are high risk but legitimate securities. Unlike other 4th quadrant securities, there is plenty of money to be made in shorting lottery tickets but only for the select few with the skill, capital, and government authorization to start a lottery business!
[Back to Table of Contents]
Final Thoughts
Asymmetric payoffs, which the human brain isn’t naturally equipped to comprehend, are very widespread in the returns of many financial instruments. It’s important to realize that although many financial analysts use the normal distribution (or log-normal) to model returns of financial instruments, this sort of approximation usually fails at the tails of the distribution when dealing with rare events, and we call these fat tails “skew”. Understanding which direction the asset return distributions exhibit skew is just as important as understanding their expected return in order to construct a sensible trading strategy and manage risk prudently.